
Knowledge Graphs are Marketing’s New Superpower
- Orrin Broberg

- Oct 13, 2023
- 2 min read

You may not have heard about knowledge graphs or graph databases, but they have been around for a while. They are a part of AI and have been used to identify patterns in lots of interconnected relationships.
Knowledge graphs are now becoming mainstream as a way to glean insights from tangled or interconnected relationships such as customer, marketing, and sales enablement data. It is much slower and harder to find patterns in these connections with a SQL database.
Knowledge Graphs vs. Relational Databases
While data warehousing is a hot topic, the emerging technology of knowledge graphs has yet to capture headlines. Knowledge representation and, with that, knowledge graphs are a key building block of AI. It’s a different way to look at data. By using knowledge graphs, you start with the question you want to be answered and then define the relationships between the data points you want to explore.
The result of using knowledge graphs is a more immediate picture of how the data points are related, and thus insights are revealed. Using knowledge graphs is a precursor to applying machine learning for recommendations.
As you can see in the following diagram, working with knowledge graphs is literally connecting the dots:

The following diagram illustrates the difference in how insights are obtained from a traditional SQL-based data warehouse and a knowledge graph:
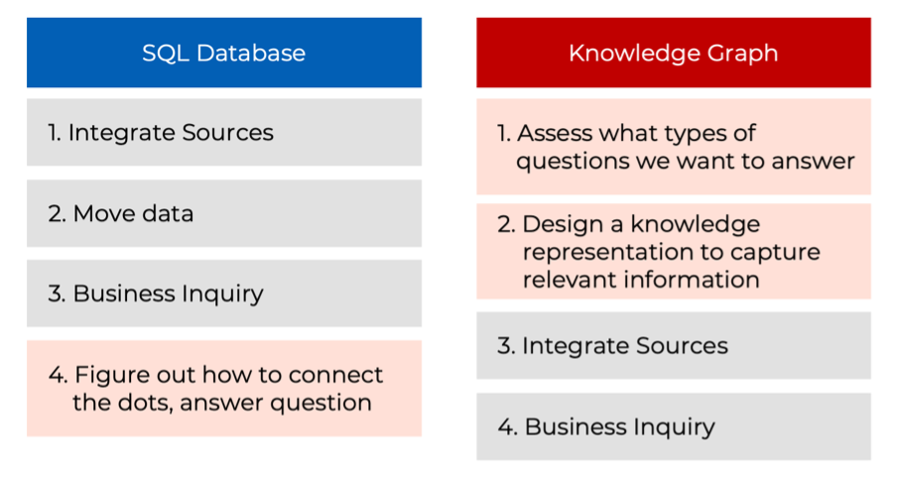
Speed and flexibility are gained by starting with the question you want answered. No more waiting for SQL-based reports from IT with limited insights.
So How Do You Use Knowledge Graphs?
First, you consolidate your data into an Enterprise Knowledge Graph in order to:
Bridge data silos
Emphasize the relationship between data points
A knowledge graph is a knowledge base built on top of a graph database
Knowledge Graphs then provide Immediate Analytics Value because they:
Capture customer journeys
Model product lifecycles
Analyze interactions between departments
Surface patterns of behavior
Knowledge graphs Enable AI and Machine Learning which means you can:
Leverage the relationships from the knowledge graph to build models
Provide more advanced analytics insights and recommendations
Before even building advanced machine learning models, a knowledge graph allows analysts to analyze patterns of behavior.
Some questions analysts use knowledge graphs to help answer are:
What kind of sales cycles are more successful?
How does the use of a marketing asset impact a sales cycle?
By traversing the interactions of assets, sales and customers, we gain a more complete picture of how marketing affects various aspects of an organization. This brings us back to the original question of evaluating the ROI of marketing.
Typically cause and effect relationships are best established through A/B testing. However A/B tests are not always possible, and can be expensive. The rich interactions typically captured in a knowledge graph are a valuable source of offline data and knowledge that can be used for discovery and also for relating the use of marketing materials to various outcomes.
Beyond assessing the ROI for marketing, there are various other potential use cases. Recommendations can be provided to salespeople via CRM to use marketing assets which are more likely to lead to closing a deal. The patterns of interactions in sales, can be used to provide sales leadership with a clear understanding of the effectiveness of their team and individuals.
Marketing leadership can have guidance on where to direct resources that have the greatest impact. And corporate management can be provided with insights to enable better-informed decisions.


Comments